Google Analytics Reports
Google analytics provide standard reporting and
custom reporting features.
General Method
Export Directly from Google Analytics Account using
standard reporting.
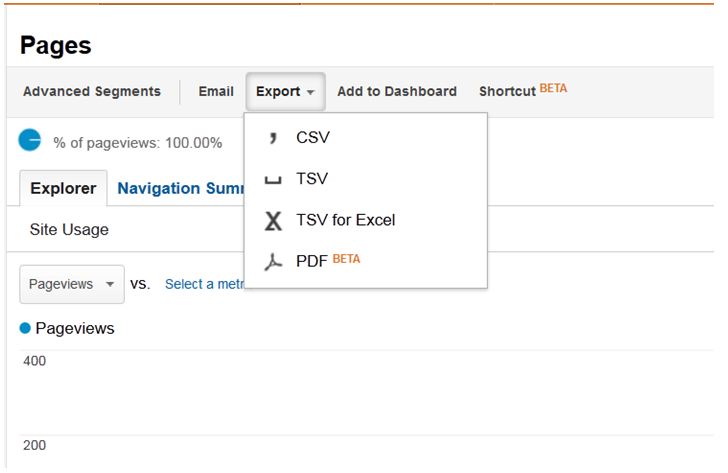
This TSV File can be generated as follows:
Export
à
TSV for Excel à
save File
By using TSV for Excel option we can create TSV file
for available data. This TSV file can be open In Microsoft Excel.
This can be done as follows:
Open
Excel à
File à
Open à
Select generated TSV File à Open
Problem Identified
TSV file generate according to the selected no rows.
User can select maximum 500 records. Even there are 1000 records in given
criteria it export first 500 records only.
To overcome this problem we identified following solutions.
Option 1 – Change Show Rows
First select show rows value other than the default
value and refresh report. Then URL is changed according to that and end of the
URL displayed no of selected rows.
To increase no of rows user must manually change
this value.
Option 2 – Use Google analytics Query Explorer
Use below link to get query explorer.
Log with your Google Account. Then it will take Account,
Web Property, Profile and ids automatically. Then add dimensions metrics, date
range and max result according to reporting format.
Details about query parameters:
Dimensions:
Columns that you need to show in report
Metrics:
Rows
If need to add filters
then it should write in following format:
ga:source=~^testing.*
Sort: sorting can be
done ascending or descending.
For an example
if you want to sort data according to page views then it must write as follows,
Ascending: ga:pageviews
Descending:
-ga:pageviews (Add (-) mark before ga variable)
start-date
and end-date: Date range for the report. This date can
be picked from date time picker.
max-results:
Maximum
number of results to retrieve from the API. The default is 1,000 but can be set
up to 10,000.